Class providing text-based UI allowing to plot power traces, correlation traces or t-value traces. More...
#include <visu.h>
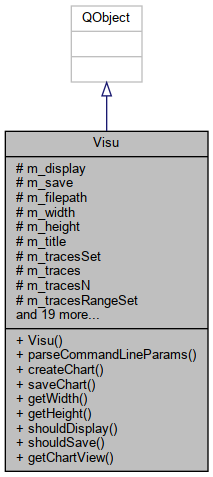
Inheritance diagram for Visu:

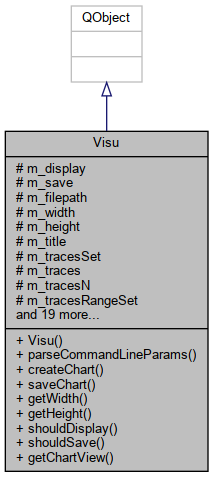
Collaboration diagram for Visu:

Classes | |
| struct | CorrelationTraceSeries |
| struct | PowerTraceSeries |
Public Types | |
| enum | CommandLineParseResult { CommandLineProcessChart, CommandLineNOP, CommandLineError, CommandLineVersionRequested, CommandLineHelpRequested } |
Public Slots | |
| bool | createChart () |
| Creates a chart based on the parameters set by parseCommandLineParams. | |
| bool | saveChart () const |
| Save created chart to the specified file. | |
| size_t | getWidth () const |
| size_t | getHeight () const |
| bool | shouldDisplay () const |
| bool | shouldSave () const |
| QChartView * | getChartView () const |
Signals | |
| void | finished () |
Public Member Functions | |
| Visu (QObject *parent=0) | |
| CommandLineParseResult | parseCommandLineParams (QCommandLineParser &parser) |
| Parse parameters from the command line and configuration files. | |
Protected Attributes | |
| bool | m_display |
| bool | m_save |
| QString | m_filepath |
| size_t | m_width |
| size_t | m_height |
| QString | m_title |
| bool | m_tracesSet |
| QString | m_traces |
| size_t | m_tracesN |
| bool | m_tracesRangeSet |
| double | m_tracesRange |
| bool | m_tValsSet |
| QString | m_tValues |
| bool | m_correlationsSet |
| QString | m_correlations |
| size_t | m_correlationsSetsQ |
| size_t | m_correlationsCandidatesK |
| size_t | m_samplesPerTrace |
| bool | m_samplesRangeSet |
| double | m_samplesRange |
| bool | m_plotTVals |
| QString | m_tValsColor |
| QList< PowerTraceSeries > | m_powerTracesToPlot |
| QList< CorrelationTraceSeries > | m_correlationTracesToPlot |
| QChart * | m_chart |
| QValueAxis * | m_axisX |
| QValueAxis * | m_axisYtraces |
| QValueAxis * | m_axisYcorrs |
| QValueAxis * | m_axisYtvals |
Detailed Description
Class providing text-based UI allowing to plot power traces, correlation traces or t-value traces.
The documentation for this class was generated from the following files:
 1.8.15